Introduction to the Generic Visuals in the News project through Existing Data Sets I.
How are ‘generic visuals’ created and by whom?
by Camilla Mørk Røstvik :
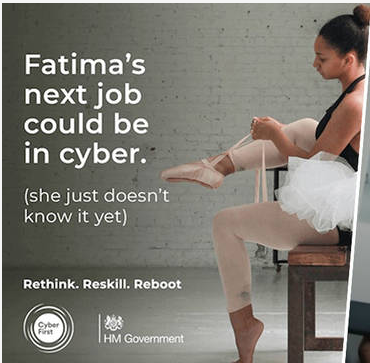
Concentrating intensely, a young ballet dancer carefully laces her shoes. Next to her, another dancer is warming up. Across the room, a photographer captures the moment, their bodies perfectly aligned on a bench, white fluffy tutus blending into one. They are the aspirational images of success, skill and strength so long upheld by Western beauty standards, celebrated for the acute pain and difficulty of their work, and the elite position of their institutions.
UK government 'Rethink. Reskill. Reboot' campaign, November 2020.
As has been detailed by commentators ever since its publication, the image was cropped and taken out of context in a grim post-pandemic world that has little time or space for the arts. One dancer is edited out of the shot, the remaining woman recast as British rather than American, the fictional ‘Fatima’ eclipsing the real Desiree Kelley. She is to stand in for the UK government’s new reskilling program: ‘Rethink, Reskill Reboot’, with the message: ‘Fatima’s next job could be in cyber (she just doesn’t know it yet)’. The campaign suggests that young people should consider their creative dreams and be more realistic about their futures. Who needs creativity in a pandemic?
The discussion of this image and its contextualisation happened in the same month that our new project ‘Generic Visuals in the News’ began. The three-year research endeavour will examine the creation and discourse surrounding events such as these, as well as the use of stock photography, graphs, charts and other visualisations that may be considered general, simple, clear, glib, bland, comprehensive, or any combinations of these. We take an agnostic approach to the term ‘generic’, with no assumptions as to whether it is generally seen as a positive or negative trait. We will talk to both creators and viewers, and track how ‘generic visuals’ assemble various audiences.
Despite the changes to our project necessitated by the pandemic, it has also been a fruitful time to collect examples of ‘generic visuals’. From the reskilling campaign, to the vast landscape of Covid-19 graphs and the tense US election, data was being organised into systems and visual representations to inform, soothe and convince readers at a time when physical interactions and communication was impossible.

Stock photographs representing the US election in 2020 often featured US flags against a clear blue sky. Image by fancycrave1 from Pixabay.
Although the past tells us that this is not a new state of affairs, our project will have the advantage of tapping into some unique and historic events of the 21st century. Drawing on previous research and undertaking our own with partners in news organisations, we hope to contribute to a more complex understanding of how audiences are imagined and reached by media.
Exploring existing data
When beginning our project, we were somewhere in a pandemic. Not physically able to meet or to begin the project as imagined, we turned to the academic team members’ existing data sets to explore if there could be fruitful information within. There was!
We surveyed the interview materials from several completed or ongoing research projects: ‘Innovative Data Visualization and Visual-Numeric Literacy’ (INDVIL) and the ‘Visualising Data’ projects headed by Professor Helen Kennedy, and Dr Giorgia Aiello’s interviews with stock photographers in London and New York. Applying our own project remit and goals to these existing datasets, we were able to start noticing gaps, as well as knowledge we already had as a collective group. In this series of posts, we discuss the major themes visible in these data sets, and outline the ways in which this might inform our ‘Generic Visuals’ project.
How do creators of ‘generic visuals’ do their work?
In both datasets, visualisations typically began in one of two ways: A) an ad hoc need arose from a rapidly moving news story, or B) a team planned ahead for fixed-date events such as elections.

Stock photography and simple data visualization are often used to illustrate both ad hoc events and news stories that can be planned. Image by Tumisu from Pixabay.
In the case of ad hoc creation, image makers were usually quickly thrown into an already existing team and project. The comment ‘let’s get some data on it!’ sums up the chaotic, creative and urgent working process that often followed. In contrast, stock photographs are also needed urgently, while their creators make their work to anticipate future needs.
In the case of long-term data visualisation projects connected to fixed-date events, visualisers had more space to come up with their own ideas and work in creative, independent ways. This included making large packages for a sports event, building an algorithm, or traveling to the other side of the world to take photographs in a beautiful location.
In both cases, these findings are useful for our ‘Generic Visuals’ project as it helps us understand how image makers work, and how their position in a team might influence their thinking when creating data visualizations or stock photography.
Choosing a topic and popularity
Some topics have been historically rich sources for data visualisers; notably sports, crime, immigration numbers, and large elections. For stock photographers, the trick is to anticipate what stories might be popular, and to predict the future to such a degree that sudden trends may be illustrated. During the ‘Generic Visuals’ project, it will be important to both trace themes that are consistently visually represented, and to be mindful of any emerging events, such as Covid-19, elections, or protests.
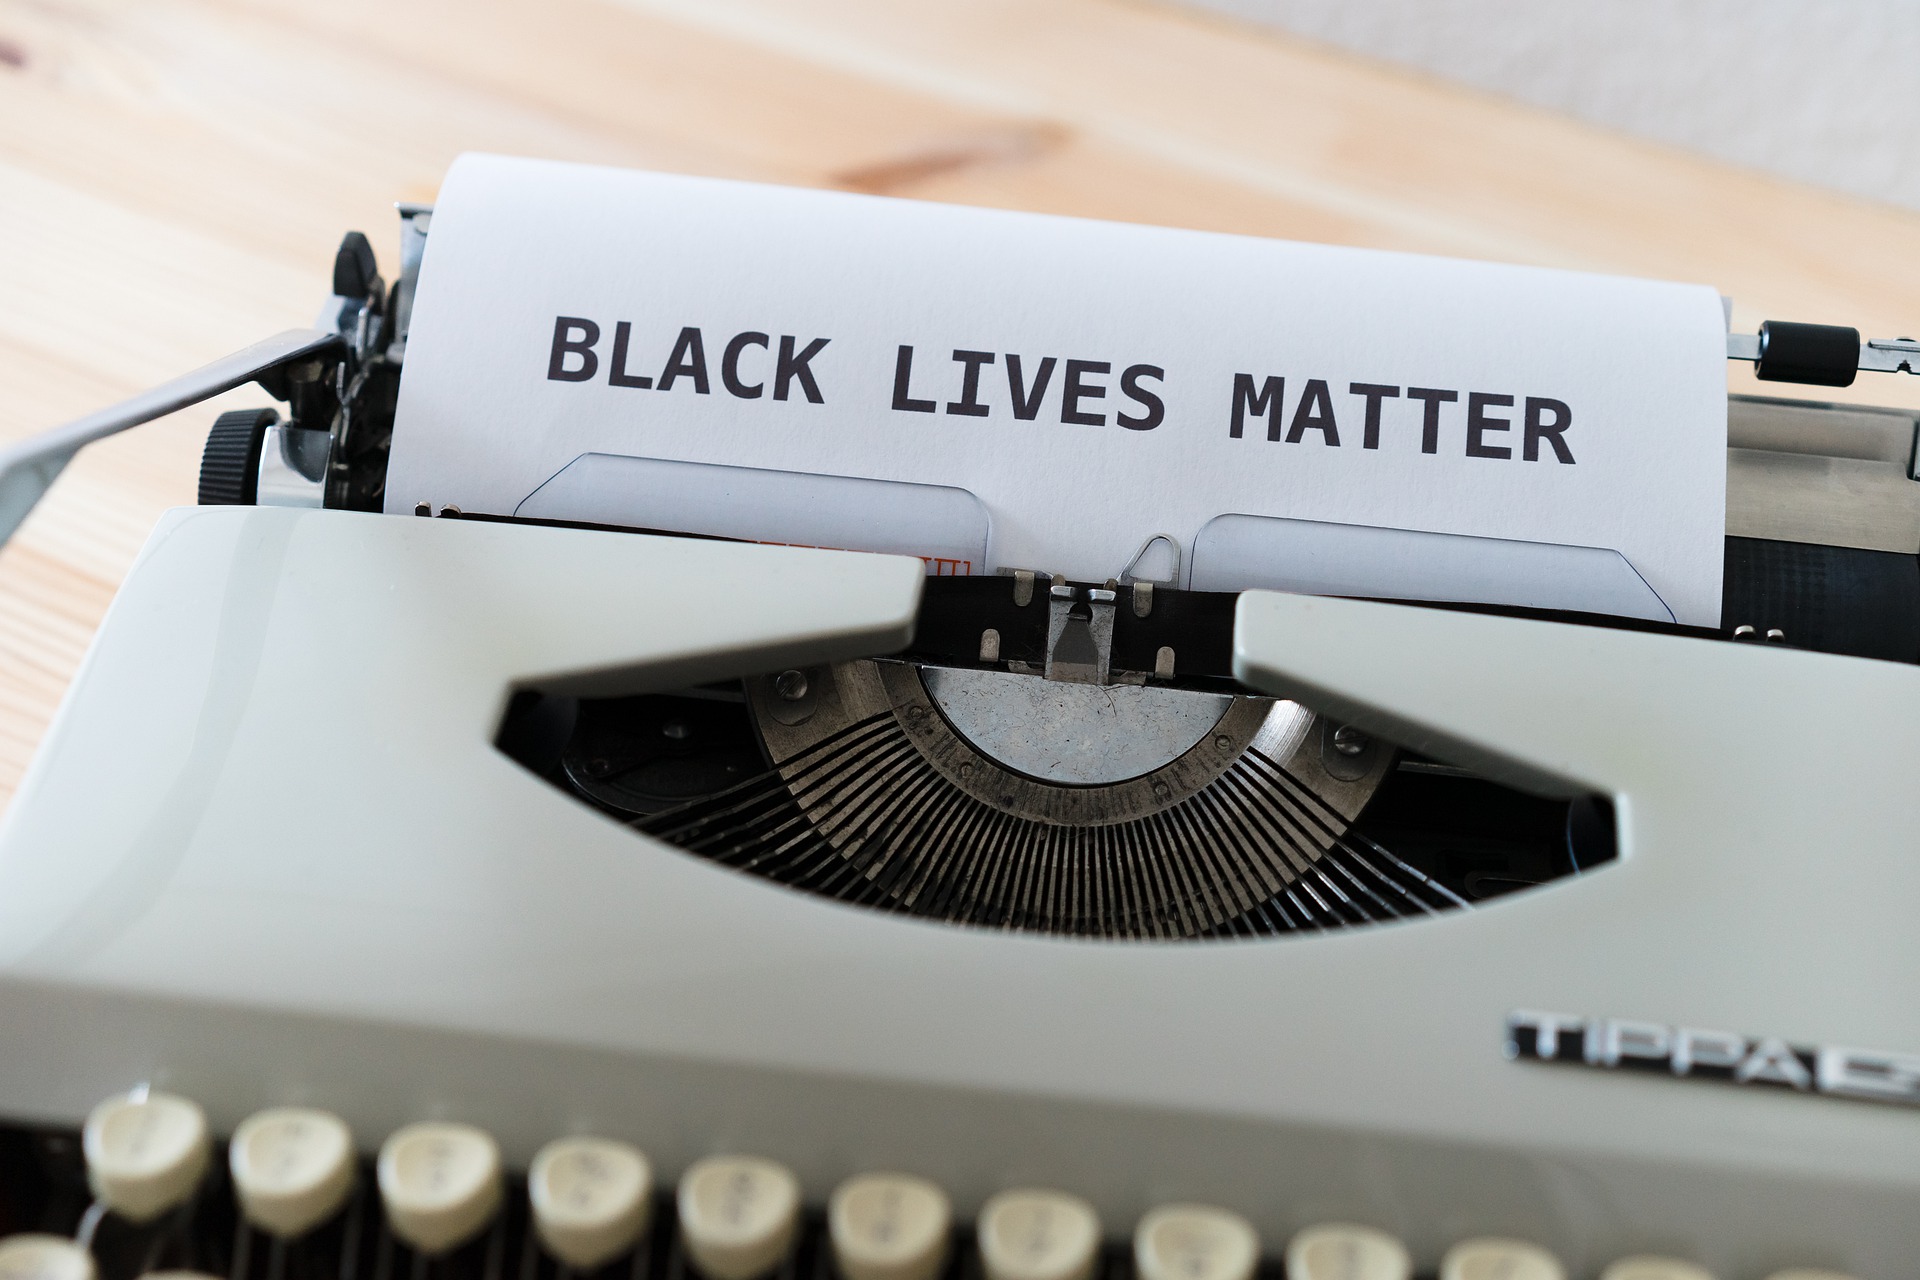
As Black Lives Matter protests happened across the world, the need for stock images to illustrate increased. Image by Markus Winkler from Pixabay
The choice of the theme and content of images is seldom only up to the creators. The existing datasets show the importance of editorial management, newsroom control, line managers and teams in creating work. If Getty or other major visual content providers decline a group of photographs, photographers may feel confused about the reasons behind this rejection but will have to deal with the resulting loss of time and up-front costs themselves, while maintaining a professional and calm attitude. Overall, editing of ‘generic visuals’ is intense from start to finish, and involves several rounds of input, culminating in the public who may also have strong opinions.
Beyond editorial and public commentary, creators must also reckon with institutions. There is a growing sense that ‘everyone’ must have data visualisations today, and there can be tension between clients and editors when deciding where and when to include it. Furthermore, data visualisers and stock photographers may own their work, but they do not have a final say in how, when and where it is used. Images may show up in a surprising context, be misinterpreted, buried under extensive copy, or appropriated. We want to learn more about the ways image creators, editorial control, and audiences assemble various ways of viewing and understanding the resulting images.
The role of the image maker: Pioneer, out of place, or an elite?
Because data journalism is relatively new, the field is still experimental. Their education in journalism, visual arts, or graphic design had not prepared them for what they would be doing, as the start of their working life coincided with the digital revolution.
Data visualisers had conflicting thoughts about their reputation. Some thought they were seen as nerds, elites, niche or very clever. Others suspected that colleagues saw them as dull, technical, and rather unimpressive. Either way, both data visualisers and stock photographers are no doubt usually part of a privileged set of people with access to education, technology, and money for up-front costs.
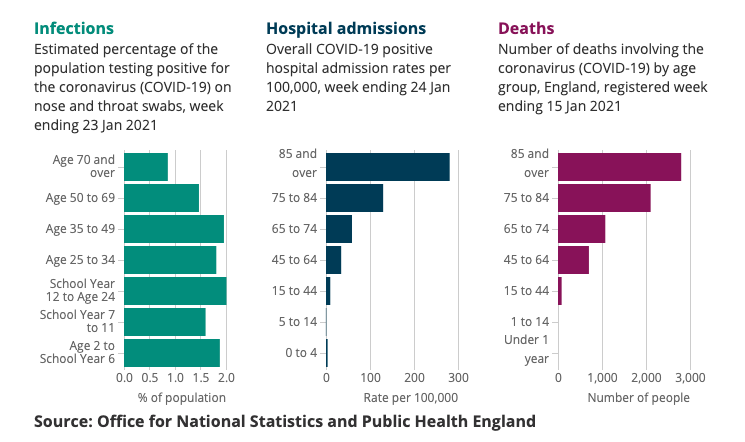
Data visualization showing infection rates, hospital admission, and death caused by Covid-19. Source: Office for National Statistics and Public Health England.
They are also a rather anonymous group by the standards of visual image making. The name of the creator(s) of stock photography or data visualisation is often missing or buried behind several institutional owners such as Getty or a news organisation. For consumers of both data visualisation and stock photography, it can be difficult to find out who made an image.
What then, makes a good ‘generic visual’? In contrast to data visualisers, there was a sense from stock photographer interviewees that anyone could be a stock photographer, but not necessarily a ‘good’ or ‘successful’ one. What constitutes good or successful varies, but generally means selling images to many libraries, and capturing images that can be ‘tagged’ and contextualised in many ways. Many felt expendable, especially after the digital shift which had rendered members of the general public instant content creators by way of phone technology. Whereas previous generations of stock photographers were often commissioned to work on a theme, today’s creators seek out themes independently. They are perhaps more autonomous, but also more precarious in terms of employment.
Perhaps because of the precarious nature of their work, photographers and data visualisers sometimes also have private practices in which they make art, develop products, video games, or other creative work. After a full working day of creating generic images, it seems that creators seek rest and inspiration in the making of specific images and products. As such, their work is intimately tied to the worlds of art and creativity, which we look forward to exploring.