Pilot Study of Generic Visuals of Brexit and Covid-19 (II): Focus on data visualisations
by Helen Kennedy :
This is the second of three blogposts about our pilot study of generic visuals of Brexit and Covid-19 in the news. This post focuses on data visualizations.
In March, we posted a blogpost based on our pilot study of generic visuals of Brexit and Covid-19 in the news. That blogpost focused on uses of stock photography to represent these news stories. As we noted there, we carried out this two-week pilot study in 14-18 December 2020 and 4-8 January 2021, in order to gain deeper understanding of how visuals are used in online news stories, and to begin to develop the methodological and conceptual tools for our longer-term project. The pilot identified examples of stock photos and data visualisations and considered whether we need to include other types of images in our research.
This blogpost focuses on the data visualisations, or dataviz, that we found as part of this exercise. We sampled images from all stories about our chosen topics that were linked to from the homepages of our partners’ websites, the Financial Times, BBC Yorkshire and the Reach Media group. Because the Reach group includes a range of publications, we randomly sampled one newspaper and one website each day.
We initially sampled the first photo and the first dataviz in each story, collecting around 100 images, about a quarter of which were data visualisations. This already tells us something about visuals in the news. Although simple data visualisations like bar charts, line charts and coloured maps have been key in communicating about Covid-19, their use is less common than other visual imagery like photos. This has long been the case. I found in interviews with data and visualisation journalists as part of the INDVIL research project that news stories have historically led with a human interest visual, usually a photo. If used, data visualisations then appear ‘below the fold’. And in scoping research for Generic Visuals in the News, we found that stock images were used as opening visuals in news stories that then also featured dataviz in the body of the article.
Because our sampling method led to an imbalance in stock photos and dataviz in our sample, and because our research focuses on both, in later searches we adapted our approach to ensure a better balance of both types of image for a later search, instead sampling the first photo and all dataviz in a given story. We retrospectively applied this approach to our initial December/January sample, and this led to a better balance of stock photos and dataviz, 79 stock photos and 43 ‘dataviz’ (we unpack the meaning of this term below).
Inevitably, then, dataviz were clustered in particular stories, rather than being used evenly across all stories. They mostly come from The Financial Times, seen by some commentators as playing a leading role in using datavis to tell news stories in UK journalism – 32 of the 43 dataviz in the sample are from the FT. And all except two are about Covid, perhaps not surprisingly, given the daily production of new data on the topic. There are three things worth noting about the dataviz in the sample.
First, the three most standardised, or generic, graph types – bar charts, line charts and maps – are commonly used. For example, in Figure 1: a bar chart from a FT story about Brexit, representing the changing value of the UK’s wine and spirits markets; line charts from an FT story about the emergence of the Kent Covid variant; and a Covid-related map, from Devon Live, part of the Reach Group, showing lockdown status.
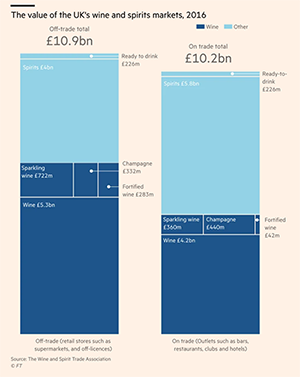
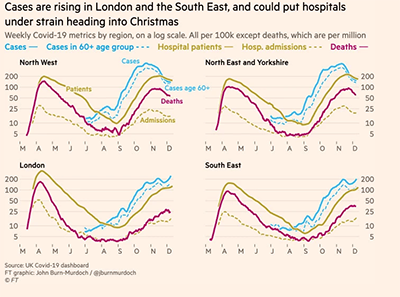
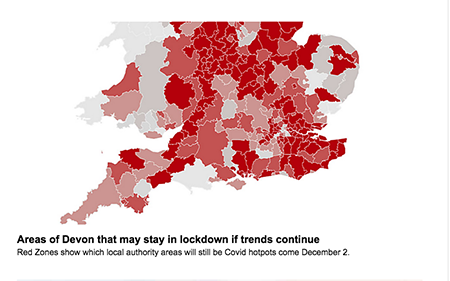
Figure 1: bar chart from FT story about Brexit, showing changing value of UK’s wine and spirits markets; line charts from FT showing spread of Covid Kent variant & heat map from Devon Live showing lockdown status in the region.
Second, more complex graph types are also used, but only by the FT. For example, a Sankey diagram is used to show where the UK’s wine imports come from, in its story about Brexit. This story starts with the simple bar chart shown in Figure 1 above, and then continues to introduce more complex chart types ‘below the fold’. In its Coronavirus tracker the FT uses multiple graph types, including the stream graph shown in Figure 2. A story about Covid case rises in London uses a scatterplot to represent data. The use of these graph types shows that FT is not afraid of introducing its readers to unfamiliar data visualisations, which in turn tells us something about the paper’s readers and its journalists’ expectations of them. It also raises a question about whether they can be considered generic, and what is included and excluded in our concept of generic visuals. In response to these questions, FT staff who we have been as part of Generic Visuals in the News have indicated where the line between generic and bespoke images might lie – more on this soon.
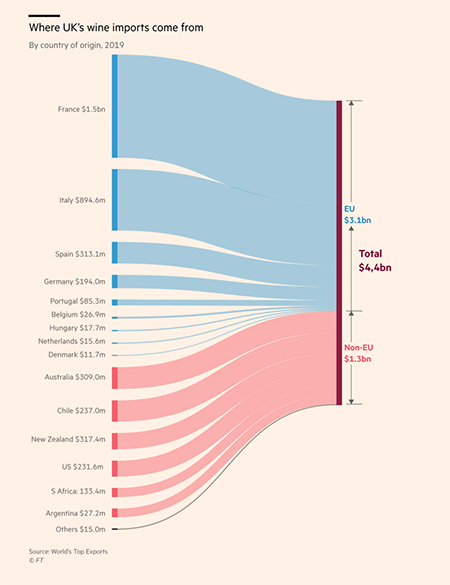
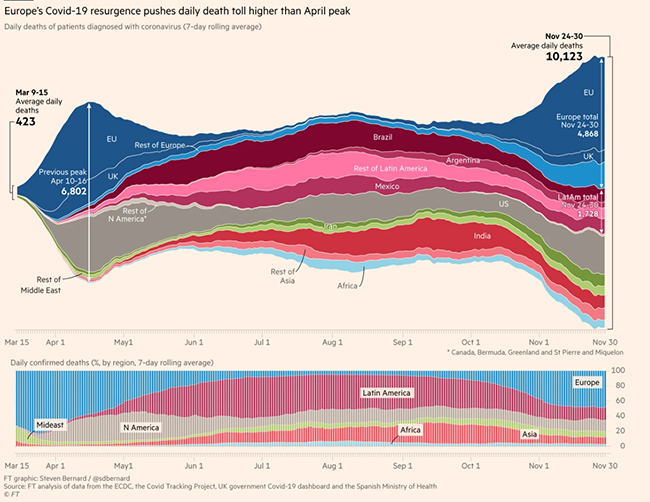
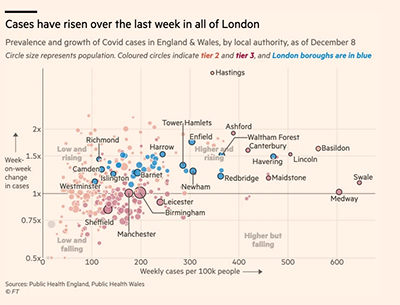
Figure 2: a Sankey diagram of UK wine imports; a stream graph of Europe’s Covid resurgence, and a scatterplot of Covid case rises in London, all from the FT.
Finally, as noted above, one of the aims of the pilot was to consider whether we need to include image types other than stock photos and dataviz in our research. The answer to that question appears to be yes. Included in our dataviz sample, but not really dataviz, are an infographic from a story circulating across BBC news webpages about how Covid-19 test-and-trace works and a visual representation from another news feature illustrating how the vaccine immunity process works. Both of these deploy dataviz aesthetics, but they don’t include any actual data, communicating facticity where there are no facts. Figure 3 below, from a story entitled ‘Latest R Number by NHS England Region’ on The Mirror’s website, is a visual, and it contains data, but the data is not visualised. Of course, the iconic Flatten the Curve visual could also be described as ‘dataviz-aesthetic-but-no-data’, arguably visually blurring the boundary between real and imaginary data.
Sometimes images combine visual elements from both stock photography and data visualisations, such as the headline image from the FT’s ‘Jump in London Covid cases’ story cited above, also shown in Figure 3. And finally, of course, sometimes data is presented non-visually, in a simple list or table.
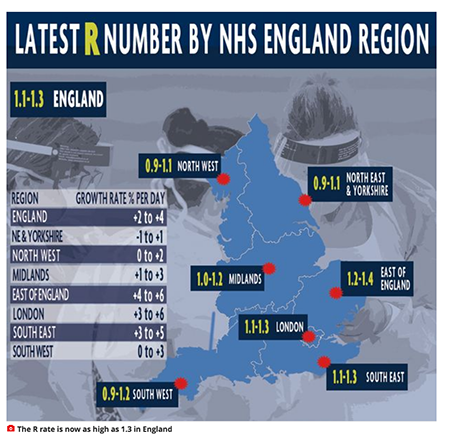

Figure 3: ‘Latest R Number by NHS England Region’ from The Mirror; combined stock photo + dataviz aesthetic image leading an FT story about the rise in Covid cases in London due to the Kent variant.
How should we caterogise these various visuals (and non-visuals): dataviz or not? Generic of not? And are categorisations helpful anyway? These are questions for us to explore in our research as we proceed.